


TL;DR:
- Undervalued energy assets are priced below their intrinsic worth based on sector-specific valuation models. They require careful analysis of reserves, commodity cycles, and asset lifecycle, rather than relying on standard tools like P/E ratios. Using NAV, normalized metrics, and sector-appropriate discount rates helps identify genuine value and avoid common pitfalls.
An undervalued energy asset is one trading below its intrinsic worth as measured by reserve-based or cash flow models specific to the energy sector. Knowing how to identify undervalued energy assets separates investors who generate consistent returns from those who chase headlines. Standard valuation tools like price-to-earnings ratios fail in this sector because commodity prices swing earnings dramatically from one year to the next. The methods that work, including the Net Asset Value (NAV) model, EV/EBITDA, and normalized earnings analysis, are built around the energy sector’s unique economics: depleting reserves, commodity cycles, and long asset lives.
How to identify undervalued energy assets: why standard models fail

Energy assets are fundamentally different from industrial or consumer businesses. Their value comes from finite, depleting reserves rather than recurring product sales. A standard discounted cash flow (DCF) model assumes a terminal value, which makes no sense for an oil well that will produce nothing after 20 years.
Commodity price volatility distorts earnings so severely that a simple P/E ratio becomes almost meaningless. An E&P company can look cheap at 8x earnings during a price spike and genuinely cheap at 15x earnings during a trough. Buying at a low P/E during peak commodity cycles is one of the most common value traps in energy investing.
The core problem is that standard models measure what happened, not what the asset is actually worth. Energy analysts need tools that account for:
- Reserve depletion: Production declines every year without new drilling or acquisitions.
- Commodity price cycles: Earnings in any single year reflect a price environment that may not persist.
- Asset lifecycle: Wells, pipelines, and power plants have defined productive lives that must be modeled explicitly.
- Breakeven costs: The price at which production becomes uneconomic sets a floor on asset value.
Pro Tip: Never screen energy stocks using trailing P/E alone. Use at least a three-year average of normalized earnings to remove the distortion of a single commodity price cycle.
The solution is to use sector-specific valuation techniques. The NAV model handles E&P companies. EV/EBITDA and free cash flow yield work as secondary filters. Renewable energy assets require their own framework built around contracted cash flows and merchant tail risk.
How does the NAV model work for E&P companies?
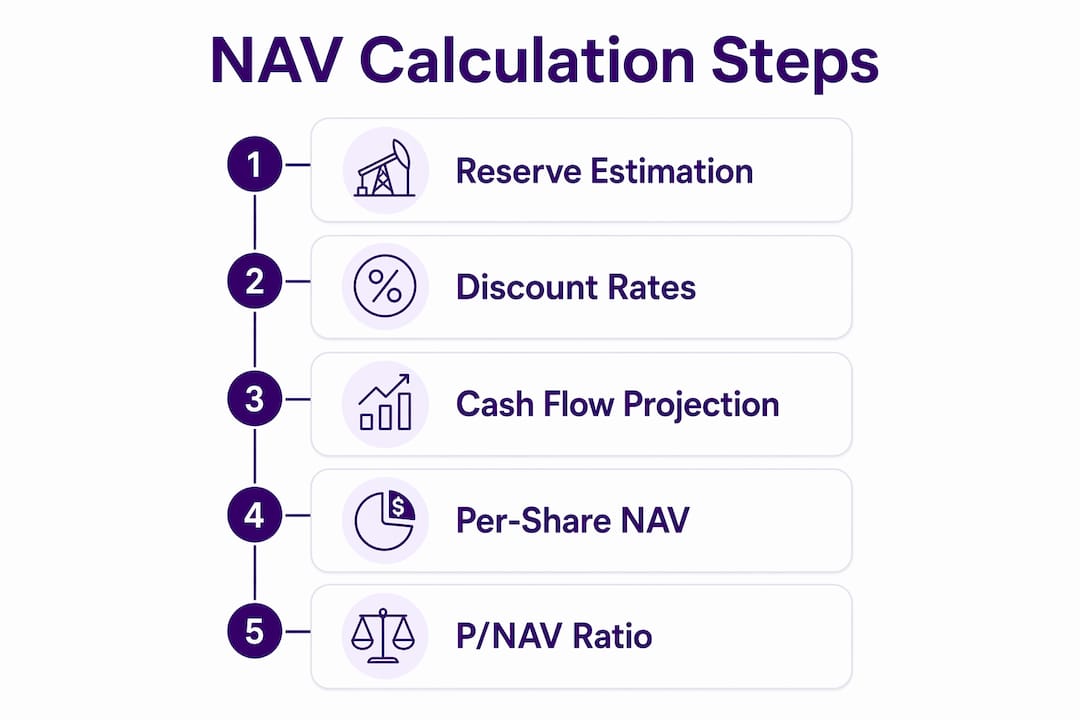
The NAV model is the preferred valuation method for exploration and production companies because it projects cash flows over the full reserve life of 20–40 years, then discounts them back to present value. A company trading at a Price-to-NAV (P/NAV) ratio below 1.0x is trading at a discount to its reserve value. A P/NAV of 0.8x signals potential undervaluation of roughly 20%.
Step-by-step NAV calculation
- Categorize reserves. Separate Proved Developed Producing (PDP), Proved Developed Non-Producing (PDNP), and Proved Undeveloped (PUD) reserves. PDP reserves carry the least risk and receive the lowest discount rate. PUD reserves are riskier and discounted more heavily.
- Apply decline curve analysis. Model how production falls over time for each well or field. Professional buyers adjust the “b-factor” in shale well decline curves to reflect realistic production declines. This adjustment typically lowers NAV by 12–18% compared to seller projections.
- Set price assumptions using strip pricing. Reserve reports filed with the SEC use a conservative 12-month trailing average price. That figure understates value when prices are rising. Strip pricing uses futures market prices for the next 1–3 years, which better reflects current market expectations.
- Discount the cash flows. Apply a risk-adjusted discount rate to each reserve category. PDP cash flows typically use rates in the 8–10% range. PUD reserves use higher rates to reflect development risk.
- Adjust for corporate factors. Subtract net debt, add any hedging value, and account for corporate overhead costs.
The result is a per-share NAV. Divide the current stock price by NAV to get the P/NAV multiple.
| Reserve Category | Risk Level | Typical Discount Rate |
|---|---|---|
| PDP (Proved Developed Producing) | Low | 8–10% |
| PDNP (Proved Developed Non-Producing) | Medium | 10–12% |
| PUD (Proved Undeveloped) | High | 12–15%+ |
Pro Tip: Always request an independent engineering report rather than relying solely on company-prepared reserve estimates. Independent teams routinely revise b-factors downward, which prevents you from overpaying based on optimistic seller projections.
Sophisticated buyers do not stop at NAV alone. Triangulating NAV with EBITDAX multiples and comparable transaction data produces a more defensible price range. If all three methods point to undervaluation, the conviction level rises significantly.
What financial metrics reveal undervalued energy stocks?
Beyond NAV, several quantitative filters help analysts screen for undervalued energy stocks across the broader sector. These metrics work best when applied over multiple years to smooth out commodity price swings.
Normalized earnings replace a single year’s reported earnings with an average calculated across a full commodity cycle, typically five to seven years. This removes the distortion of unusually high or low prices and gives a cleaner picture of earning power. Buying at a low trailing P/E during a commodity peak often leads to losses when prices normalize. Normalized earnings prevent that mistake.
EV/EBITDA is the ratio most widely used by long-only energy fund managers. It strips out the effects of capital structure and tax differences, making it easier to compare companies across different jurisdictions. ConocoPhillips trades at an EV/EBITDA of 5.93x, a figure commonly used as a reference point by institutional energy analysts. A company trading at a significant discount to sector peers on this metric warrants deeper investigation.
Free cash flow yield measures how much cash a company generates relative to its market capitalization. High free cash flow yield in energy often signals that the market is pricing in a commodity downturn that may not materialize. Comparing free cash flow yield against the company’s oil and gas depreciation methods and capital spending plans adds another layer of insight.
Dividend coverage ratio matters for income-focused investors. An energy company paying a dividend covered three times over by free cash flow at mid-cycle prices is far more attractive than one barely covering its payout at peak prices. The dividend coverage ratio at normalized commodity prices is the number that counts.
The most effective screening approach combines all four metrics. A company showing low EV/EBITDA, high free cash flow yield, solid dividend coverage, and a P/NAV below 1.0x presents a genuinely compelling case for undervaluation. One metric alone is never enough. You can also learn more about common ETF pitfalls that cause investors to misjudge sector value.
How do you value renewable energy assets differently?
Renewable energy assets require a separate valuation framework because their cash flow structure differs fundamentally from oil and gas. Most utility-scale solar and wind projects operate under Power Purchase Agreements (PPAs), which provide contracted revenue for 10–20 years. After that contract expires, the asset enters what analysts call the “merchant tail.”
Levered equity IRR targets for contracted renewable portfolios typically fall in the 8–12% range. Debt costs around SOFR plus 150–250 basis points, and the debt-to-equity structure heavily influences equity returns. A project with higher leverage amplifies equity returns when things go well and magnifies losses when they do not.
The merchant tail is where valuation gets genuinely complex. This period can represent 10–20 or more years of asset life, but future power prices are uncertain. Analysts value the merchant tail using discount rates of 9–14%, significantly higher than the rates applied to contracted cash flows. A project whose merchant tail is being ignored or heavily discounted by the market may represent a genuine opportunity.
Key risk factors specific to renewable assets include:
- Curtailment risk: Grid operators may force projects offline during periods of excess supply, reducing actual generation below modeled output.
- Degradation rates: Solar panels and wind turbines lose efficiency over time. Overly optimistic degradation assumptions inflate projected cash flows.
- Refinancing risk: Projects relying on cheap debt face margin compression when interest rates rise at refinancing.
- Regulatory changes: Feed-in tariffs, tax credits, and interconnection rules can change, altering project economics materially.
Pro Tip: When evaluating renewable infrastructure, model the merchant tail under at least three power price scenarios: base, bear, and stress. The spread between those outcomes tells you more about risk than any single IRR figure.
Operational quality also matters more than most investors realize. Consistent preventive maintenance raises the market value of energy equipment regardless of asset age. A well-maintained wind farm with detailed service records commands a higher valuation than a comparable project with deferred maintenance, even if the nameplate capacity is identical.
Key Takeaways
Identifying undervalued energy assets requires combining NAV modeling, normalized financial metrics, and sector-specific risk analysis rather than relying on any single valuation tool.
| Point | Details |
|---|---|
| NAV model is the foundation | A P/NAV below 1.0x signals undervaluation; adjust b-factors for realistic decline curves. |
| Strip pricing beats SEC averages | Use futures strip prices instead of trailing 12-month averages for more accurate cash flow projections. |
| Normalize before you screen | Apply EV/EBITDA and free cash flow yield over a full commodity cycle, not a single year. |
| Renewable valuation needs two rates | Contracted cash flows and merchant tail cash flows require separate, higher discount rates. |
| Triangulate across methods | NAV, EBITDAX multiples, and comparable transactions together produce a defensible price range. |
Why I think most energy investors undervalue the valuation process itself
Most investors I see entering the energy sector treat it like any other cyclical sector. They pull up a P/E ratio, compare it to the market average, and call it cheap. That approach works reasonably well in consumer staples. In energy, it is how you lose money at the top of a commodity cycle.
The insight that changed how I think about this space is that energy assets are not businesses in the traditional sense. They are depleting inventories with a price attached. The moment you internalize that, you stop asking “what did this company earn last year?” and start asking “what are these reserves actually worth at a mid-cycle price?”
The other mistake I see constantly is ignoring the long-term value signals that come from operational quality. A company with excellent maintenance records, low lifting costs, and conservative reserve reporting is almost always a better investment than one with flashy production growth and aggressive booking. The former compounds quietly. The latter tends to disappoint.
My honest advice: never rely on a single valuation method. If NAV says cheap but EV/EBITDA says fair and comparable transactions say expensive, that disagreement is information. Dig into why the methods diverge before committing capital. The answer to that question usually reveals whether you have found a genuine opportunity or a value trap hiding in plain sight.
— Sharif
Fieldvest connects investors to vetted U.S. energy opportunities
Accredited investors who understand energy asset valuation are in the best position to act when genuine opportunities appear. Fieldvest connects high-earning professionals with vetted U.S. oil and gas operators offering large first-year tax deductions and long-term cash flow from producing assets.

You can use Fieldvest’s free tax deduction calculator to estimate your first-year deduction before committing capital. The wealth projection tool models after-tax compound growth so you can see the long-term impact of energy income on your portfolio. For investors ready to put their valuation knowledge to work, Fieldvest’s platform provides the operator access and tax efficiency that direct energy investment requires.
FAQ
What is the NAV model in energy investing?
The Net Asset Value (NAV) model values an E&P company by projecting cash flows over the full reserve life and discounting them to present value. A P/NAV ratio below 1.0x indicates the company trades at a discount to its reserve-based intrinsic value.
Why is EV/EBITDA preferred over P/E for energy stocks?
EV/EBITDA removes the distortion caused by capital structure differences and volatile single-year earnings. It provides a more stable comparison across energy companies and commodity cycles than trailing P/E ratios.
What is strip pricing and why does it matter?
Strip pricing uses futures market prices for the next 1–3 years instead of the SEC’s conservative 12-month trailing average. It produces more accurate NAV calculations, especially when commodity prices are rising.
How is the merchant tail valued in renewable energy?
The merchant tail, the period after a PPA expires, is valued using discount rates of 9–14% to reflect the uncertainty of future power prices. This is significantly higher than the rates applied to contracted cash flows.
What makes an energy asset a value trap?
An energy asset becomes a value trap when it appears cheap on trailing earnings during a commodity price peak. When prices normalize, earnings fall and the apparent discount disappears. Normalized metrics and NAV analysis prevent this mistake.
Recommended

Get the Fieldvest Energy Brief
and AI-driven demand shifts — curated for accredited investors. Smart. Strategic. Tax-advantaged.