


TL;DR:
- Misreading oil reserves data can lead to costly misallocations of capital, as headline figures often reflect estimates rather than definitive quantities.
- Interpreting reserves requires understanding classification standards, confidence levels, development status, and the impact of economic assumptions on reported volumes.
Misreading oil reserves data doesn’t just produce a wrong number on a spreadsheet. It shapes capital allocation decisions worth millions of dollars. Investors and analysts routinely treat headline proved reserves figures as straightforward engineering facts when they’re actually the product of technical estimates, commercial judgments, and probabilistic assumptions layered on top of each other. This guide to interpreting oil reserves data breaks down the classification frameworks, step-by-step analysis methods, and verification techniques you need to read reserves disclosures accurately, avoid costly misinterpretations, and make better-informed energy investment decisions.
Table of Contents
- Key takeaways
- Your guide to interpreting oil reserves data starts here
- Analyzing oil reserves data step by step
- Common pitfalls in oil reserves interpretation
- Validating reserves data before investing
- My honest take on reading reserves data
- How Fieldvest supports smarter oil and gas investing
- FAQ
Key takeaways
| Point | Details |
|---|---|
| Reserves require commerciality | A resource is only a reserve if it meets both technical recoverability and commercial viability criteria. |
| Proved reserves carry 90% certainty | Proved reserves represent at least a 90% probability of recovery under current economic conditions. |
| Annual changes reflect more than depletion | Year-over-year reserve shifts can be driven by price changes, appraisal updates, and cost revisions, not just production. |
| Classification standards vary by jurisdiction | SPE PRMS and SEC definitions differ, making cross-company comparisons unreliable without verifying the standard used. |
| Verification requires multiple data sources | Cross-referencing reserves with production data, auditor reports, and government databases increases analytical confidence. |
Your guide to interpreting oil reserves data starts here
Before you can interpret any reserves figure meaningfully, you need to understand what that number actually represents. The term “oil reserves” gets used loosely, but its technical definition is precise and consequential. According to the SPE PRMS framework, reserves are quantities anticipated to be commercially recovered from known accumulations. Two criteria must both be satisfied: the volume must be technically recoverable, and the project must meet commercial viability requirements.
This distinction matters enormously. An accumulation that is technically recoverable but lacks regulatory approval, infrastructure access, or sufficient price support is classified as a Contingent Resource, not a reserve. Investors who overlook this routinely overvalue assets by conflating the two categories.
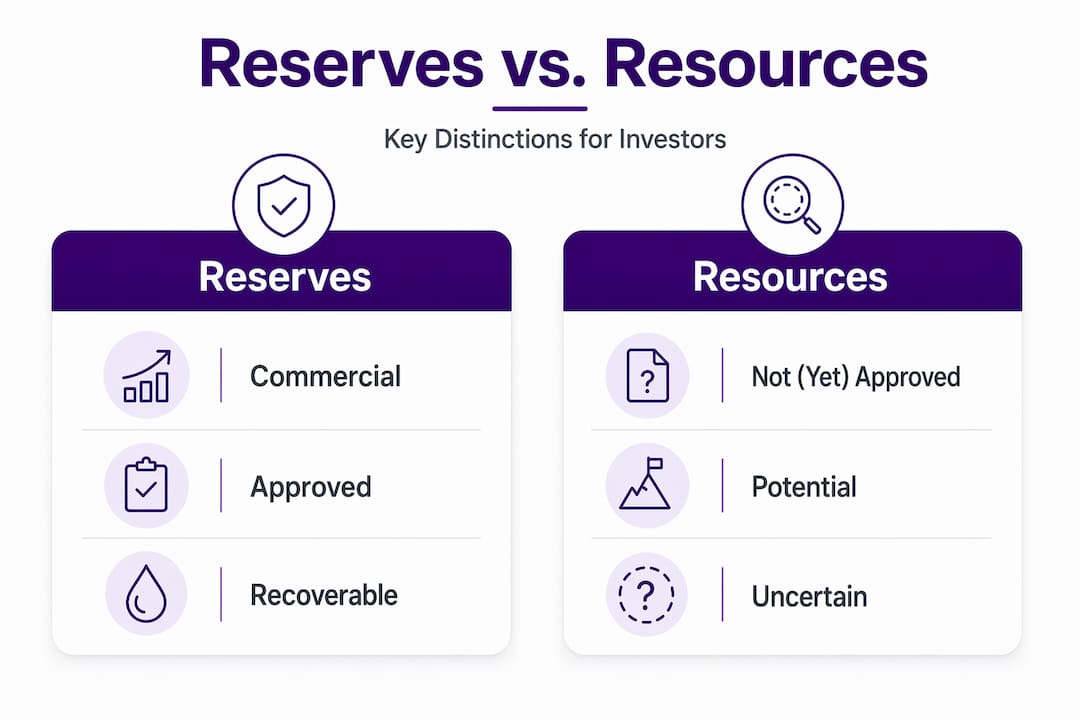
The reserves versus resources distinction
The petroleum resource classification pyramid runs from prospective resources at the base (undiscovered, unconfirmed) through contingent resources (discovered but not yet commercial) to reserves at the top (discovered, commercial, recoverable). Understanding oil reserves means recognizing that moving up this pyramid requires more than geological confidence. It requires a defensible commercial case.
The three primary reserve categories carry specific probabilistic meanings:
- Proved reserves (1P): At least 90% probability that recovered volumes will meet or exceed the estimate under current economic conditions
- Proved plus probable reserves (2P): At least 50% probability of recovery. This is the most commonly used figure in asset valuations.
- Proved plus probable plus possible reserves (3P): At least 10% probability of recovery. Treat these figures as optimistic scenarios, not base cases.
Key terminology and data sources
The table below captures the reference terms every analyst working with oil reserves data interpretation should have at hand.
| Term | Definition |
|---|---|
| Proved reserves (1P) | 90%+ confidence of recovery under current economics |
| Contingent resources | Technically recoverable but lacks commercial justification |
| Deterministic estimate | Single best-estimate value derived from geological modeling |
| Probabilistic estimate | Statistical distribution of possible outcomes (P90, P50, P10) |
| Reserve life index | Reserves divided by annual production; measures asset longevity |
| Developed reserves | Reserves expected from existing wells and infrastructure |
| Undeveloped reserves | Requires additional drilling or facility investment to recover |
Primary data sources for oil reserve analysis techniques include company annual reports and 10-K filings, reserve auditor certifications (conducted by firms like Ryder Scott or DeGolyer and MacNaughton), and government databases such as the EIA’s annual proved reserves report. Each source carries its own scope, methodology, and limitations.

Analyzing oil reserves data step by step
Oil reserves data interpretation is not a single-pass read. It requires a structured sequence of checks that build on each other.
-
Identify the reporting standard. Different organizations use different reserve definitions. SPE PRMS is the global industry standard. The SEC requires U.S.-listed companies to report under its own definition, which is more restrictive on price assumptions (using 12-month average prices rather than forward price decks). Comparing a company reporting under SEC rules to one using PRMS without adjusting for these differences produces misleading conclusions.
-
Evaluate the confidence level. Determine whether you’re looking at 1P, 2P, or 3P figures. Proved reserves demand the highest certainty. The SPE PRMS “Justified for Development” subclass requires approximately 90% confidence that commercial criteria are met and the project will proceed. Anything below that threshold should stay classified as contingent resources until the commercial case is established.
-
Check development status. Developed reserves (from currently producing wells) carry less execution risk than undeveloped reserves (requiring future drilling and capital). A company reporting large proved undeveloped reserves with limited capital budgets or no firm development timeline deserves skepticism.
-
Assess commerciality assumptions. What oil price does the company use to justify its reserves? What cost assumptions underpin the estimate? Reserve estimations are sensitive to project sanctioning, commercial approval, and economic feasibility, not just geology. If the price deck is significantly above current strip prices, the commercial justification weakens.
-
Analyze year-over-year reserve changes. This is where most analysts make mistakes. Proved reserves can decrease due to price and cost changes, new discoveries, appraisal updates, or production depletion. For example, U.S. proved crude oil reserves decreased 1% in 2024, which reflected economic and appraisal factors, not just production drawdown. Decompose the drivers before drawing conclusions.
-
Apply probabilistic risk factors. For contingent and prospective resources, apply explicit probability weights before incorporating them into valuation models. A resource with 30% chance of commercialization is worth 30 cents on the dollar relative to a proved reserve of equivalent size.
Pro Tip: Cross-validate reserves data with the company’s actual production history. A company consistently missing production targets while maintaining stable reserves figures is likely making optimistic revisions, not genuine discoveries.
| Analysis step | What to check | Red flag |
|---|---|---|
| Reporting standard | PRMS vs. SEC | No disclosure of standard used |
| Confidence level | 1P / 2P / 3P breakdown | Only headline total provided |
| Development status | Developed vs. undeveloped split | High undeveloped % with no capex plan |
| Price assumptions | Price deck used for commerciality | Price deck far above market prices |
| Year-over-year changes | Decompose drivers | Unexplained reserve additions |
Common pitfalls in oil reserves interpretation
Even experienced analysts fall into predictable traps when working with reserves disclosures. Here are the errors that cost investors the most, and how to sidestep them.
-
Treating resources as reserves. Commerciality is the key distinction between reserves and contingent resources. When a company promotes its “resource base” in investor materials without distinguishing which portion meets commercial criteria, treat those figures with caution.
-
Assuming reserve changes only reflect physical volumes. Year-to-year changes in proved reserves often reflect economic or appraisal factors beyond physical depletion or new discoveries. A reserve increase during a period of rising oil prices may have nothing to do with new wells or discoveries.
-
Misreading probabilistic confidence levels. A 2P estimate is not a conservative figure. It represents only a 50% probability of recovery. Analysts who use 2P numbers as a floor in their models are underestimating downside risk.
-
Ignoring reporting standard differences. Mapping reserve definitions helps avoid misinterpretation when comparing companies across countries or regulatory regimes. A company in Russia, Canada, and the U.S. may all report “proved reserves” under meaningfully different standards.
-
Overlooking estimation uncertainty in aggregate figures. The EIA samples approximately 95% of oil reserve operators to produce national estimates, with 385 of 398 sampled operators providing data in the 2024 report. That is excellent coverage, but it still introduces estimation uncertainty that analysts should factor into any conclusions drawn from national figures.
Pro Tip: Always read the footnotes and assumptions sections of reserves disclosures before acting on headline figures. The real story about commerciality and price assumptions lives in the fine print, not the summary tables.
Validating reserves data before investing
How to analyze oil data effectively means going beyond reading a single report. Validation requires triangulating across multiple sources.
-
Reconcile reported reserves with production data. If a company claims 50 million barrels of proved reserves but has produced only 2 million barrels in two years with no wells offline, the development timeline implied by the reserves figure should match operational reality. Gaps suggest optimistic assumptions or delayed development.
-
Understand auditor certifications and their scope. Independent reserve audits add credibility, but they are not guarantees. Auditors verify whether the company’s methodology is reasonable given the inputs provided. They rarely conduct independent subsurface work. Understand what the audit covers before relying on it.
-
Analyze disclosed economic assumptions. A valid reserves estimate requires mapping headline numbers to classification standards, confidence intervals, and commerciality constraints. Look for disclosed price decks, cost estimates, and development timelines in the supporting documentation.
-
Check supporting operational data. Well status reports, infrastructure availability, regulatory approvals, and offtake agreements all affect whether undeveloped reserves will realistically convert to production. An operator lacking pipeline access or regulatory permits for a significant portion of its undeveloped reserves is carrying execution risk that the headline number ignores.
-
Use external government and industry databases. Cross-referencing company disclosures against EIA data or relevant national regulator reports surfaces discrepancies worth investigating. Exploring U.S. oil investments in the context of national reserve trends can also provide useful benchmarking context.
-
Build probabilistic scenarios into valuation models. Rather than taking a single reserves figure as gospel, build models that weight 1P, 2P, and 3P volumes by their respective probability of recovery. This approach surfaces value ranges more honestly than single-point estimates.
Pro Tip: Use multi-source triangulation: if a company’s reserves, production profile, capital spending, and disclosed price assumptions all tell a consistent story, confidence is warranted. If even one of those four data points conflicts materially with the others, dig deeper before committing capital.
My honest take on reading reserves data
I’ve watched investors, including sophisticated ones, walk into reserves data with the assumption that a larger number is simply better. They see “2.4 billion barrels” and conclude the asset is superior to one showing 900 million barrels. What I’ve found consistently is that the quality of that figure, meaning whether it’s rooted in realistic commercial assumptions, a defensible development plan, and a price deck that reflects actual market conditions, matters more than its magnitude.
The single biggest interpretive error I see is treating proved reserves as a purely geological fact. In reality, a classification shift from proved to contingent resource can happen with no change in subsurface geology whatsoever. All it takes is a regulatory delay, a cost increase, or a sustained decline in commodity prices. That is a financial and commercial event, not a geological one, and most investors aren’t modeling for it.
The analysts who do this work well are the ones who evaluate oil projects from a commercial lens first and a geological lens second. They ask: what would it take for these reserves to fail commercial criteria? Then they stress-test the answer. That kind of thinking doesn’t require a geoscience degree. It requires intellectual discipline and a willingness to question optimistic numbers in the footnotes.
— Sharif
How Fieldvest supports smarter oil and gas investing
Understanding reserves data is one part of the investment equation. The other part is finding projects where the fundamentals actually hold up.

Fieldvest connects accredited investors with vetted U.S. oil and gas operators who offer transparent project documentation, large first-year tax deductions, and long-term cash flow from producing assets. The platform is built for high-earning professionals who want to reduce taxable income while generating energy income backed by real reserves.
If you’re ready to see how oil and gas investments could affect your tax position, Fieldvest’s free tax deduction calculator gives you a concrete starting point. For a broader look at tax-efficient oil investing, Fieldvest’s investment platform walks you through vetted opportunities built on the kind of reserves data quality that survives serious scrutiny.
FAQ
What are oil reserves exactly?
Oil reserves are quantities of petroleum anticipated to be commercially recovered from known accumulations, requiring both technical recoverability and commercial viability under the SPE PRMS framework. Volumes that are technically recoverable but lack commercial justification are classified as contingent resources, not reserves.
What is the difference between proved, probable, and possible reserves?
Proved reserves carry at least 90% probability of recovery, probable reserves represent at least 50% probability, and possible reserves represent at least 10% probability. Using 2P or 3P figures in base-case valuations without probability weighting overstates expected recoverable volumes.
Why do proved reserves change year to year without new discoveries?
Proved reserves can increase or decrease due to oil price changes, revisions to cost assumptions, new appraisal data, or project sanctioning decisions, independent of whether new barrels were discovered or produced. These economic and commercial drivers are as important as geological changes.
How do SPE PRMS and SEC reserve definitions differ?
The SPE PRMS uses a forward price deck for commerciality assessments, while the SEC requires U.S.-listed companies to use a 12-month average price. This means the same physical accumulation can qualify as a proved reserve under one standard and not the other, making cross-company comparisons unreliable without adjusting for the standard used.
How should investors verify oil reserves data independently?
Reconcile reserves with actual production history, review independent auditor reports for methodology scope, check disclosed price and cost assumptions, confirm regulatory approvals and infrastructure access for undeveloped reserves, and cross-reference against EIA or relevant government databases to identify material discrepancies.
Recommended

Join our monthly energy
market Insights Newsletter