


Reserve depletion and production decline compress the window in which a well generates taxable income, which is exactly why they reshape after-tax cash flow, valuation, and the timing of your tax benefits all at once. The IRS depletion rules and Fieldvest’s own tax deduction calculator both exist for one reason: to help you quantify that compression before you wire money.
Before you underwrite anything, do three things:
- Request the reserve report, production history, and IDC/capex breakdown from the sponsor.
- Run a quick after-tax NPV using a conservative decline curve, not the sponsor’s base case.
- Check whether the tax allocation worksheet actually matches the price deck used in the cash flow model.
Key Takeaways
Production decline and depletion together determine both the size and the timing of your after-tax return, and modeling them separately from pretax IRR is what separates a disciplined underwriter from a hopeful one.
| Point | Details |
|---|---|
| Decline shape drives cash timing | Exponential, hyperbolic, and harmonic curves each front-load or stretch out taxable income differently. |
| Depletion method changes the deduction | Cost depletion tracks units produced; percentage depletion (commonly 15%) can outlast cost recovery entirely. |
| Asset deals raise future deductions | Stepped-up tax basis in an asset purchase increases depletion and depreciation available to the buyer. |
| PV10 is not fair market value | It uses a fixed 10% discount and historical pricing, excluding tax effects and risk adjustments. |
| Fieldvest tools support verification | The tax deduction calculator and reserve data guide help investors check sponsor assumptions before committing. |
Table of Contents
- How Decline Curves Map to Annual Volumes and Cash Flow
- What Depletion Does to After-Tax Valuation
- What Tax Mechanics Actually Move the Return
- Building the After-Tax Model: Checklist and Worked Example
- What to Request From the Sponsor Before You Commit
- Red Flags That Should Pause a Deal
- Why Tax-Aware Decline Modeling Changes How You Pick Deals
- How Fieldvest Helps You Underwrite Faster
- Frequently Asked Questions
- Sources
How Decline Curves Map to Annual Volumes and Cash Flow
Understanding oil depletion effects starts with the math behind decline curves, and knowing the basics from a reliable overview like Understanding the Oil Patch: A Comprehensive Guide – WorkWearComfort helps because that math determines every dollar that shows up in your K-1 later. The standard exponential decline formula is q(t) = q0 × e^(−Dt), where q0 is initial production rate, D is the decline constant, and t is time. Most unconventional wells don’t follow a clean exponential path, though. They start hyperbolic (a steep early drop that flattens over time) and often transition to harmonic or exponential decline once the well matures.
That transition matters more than most first-time investors realize. A well modeled as pure hyperbolic decline without a terminal floor can wildly overstate estimated ultimate recovery (EUR), because hyperbolic curves mathematically imply the well keeps producing forever. The Payne Institute’s research on terminal decline rates makes the point directly: without an economic terminal floor, decline models project unrealistic long-tail production that overstates both reserves and the depletion deductions tied to those reserves.
Once you have a credible volume curve, the cash flow build is straightforward:
- Annual volume × price deck = gross revenue.
- Subtract royalties (typically 12.5% to 25% of gross, depending on the lease).
- Subtract severance and ad valorem taxes, which vary by state.
- Subtract per-barrel operating expenses, which are often part fixed and part variable.
Statistic to watch: Operating cash flow, per Stout’s post-acquisition cash flow framework, is revenue minus royalties, severance, ad valorem taxes, and operating costs. Taxable income then strips out G&A, depreciation, depletion, and IDCs before you ever get to after-tax cash flow (ATCF).
Here’s the part sponsors sometimes gloss over: a steep early decline paired with mostly fixed opex crushes margins fast in year two or three, even if year-one economics look excellent. Ask what portion of the per-barrel cost structure is truly variable before you trust a five-year projection.

What Depletion Does to After-Tax Valuation
Depletion and decline change both the timing and the total amount of taxable income a well generates, which is why a pretax NPV and an after-tax NPV on the same asset can differ by a meaningful margin. Building the discounted cash flow correctly means running these steps in order:
- Project field cash flows from the production profile and price deck.
- Apply royalties and operating costs to get pretax operating cash flow.
- Subtract abandonment costs and remaining capex obligations.
- Add back non-cash tax deductions (depletion, depreciation) after computing tax owed.
- Discount the resulting after-tax cash flow stream to present value.
Deal structure changes the math at step four. In an asset purchase, the buyer steps up the tax basis to the purchase price, which increases future depletion and depreciation deductions relative to reserves already producing under an old, lower basis. Stout’s valuation research confirms this step-up typically raises after-tax value for the buyer compared to a non-taxable stock transaction, since the deduction pool available against future income is simply larger. That’s one reason experienced sponsors often prefer structuring deals as asset purchases when possible.
One warning worth repeating every time it comes up: SEC PV10 is not fair market value. KPMG’s reserve valuation research flags this as one of the most common valuation pitfalls in the sector. If a sponsor hands you a PV10 figure and calls it the deal’s value, ask for the risk-adjusted, tax-aware DCF instead.
What Tax Mechanics Actually Move the Return
These provisions change the timing and magnitude of your taxable income more than almost anything else in the deal, so model them explicitly rather than trusting a sponsor’s summary slide.
- IDC expensing: Intangible drilling costs often constitute a large share of total drilling capital, according to HopkinsCPA’s IDC guidance, and most independent producers can elect to expense them immediately rather than capitalize them. That election drives the large first-year deduction accredited investors are usually chasing.
- Cost depletion vs. percentage depletion: Cost depletion follows units of production against your cost basis. Percentage depletion, commonly 15% of gross income for oil under IRS rules, can keep sheltering income even after your cost basis is fully recovered, which makes it a durable long-term benefit for royalty holders in particular.
- Depreciation: Tangible equipment depreciates under MACRS, with bonus depreciation phasedown schedules under the Tax Cuts and Jobs Act changing the percentage you can deduct in the acquisition year. Fieldvest’s depreciation methods guide walks through the current phaseout percentages in detail.
- AMT and passive activity rules: High-income investors need to confirm whether working interest income counts as active or passive, since that classification determines whether losses offset other income.
Pro Tip: Ownership classification decides which deductions you actually receive. Working interest owners typically get IDC and depletion deductions directly; royalty owners generally only get percentage depletion against royalty income, with no IDC exposure at all. Confirm your classification before you assume any deduction applies to you.
Building the After-Tax Model: Checklist and Worked Example
Run the model with these inputs before you commit capital:
- Production profile and EUR, including a terminal decline floor.
- Price deck (flat or strip pricing) for oil and gas.
- Royalty rate and severance/ad valorem tax rates by state.
- Operating cost per barrel, split fixed vs. variable.
- IDC and tangible capex split, plus abandonment cost estimate.
- Applicable tax rate, depletion method, and discount rate.
The stepwise flow: project volumes, convert to revenue, subtract royalties and opex for operating cash flow, subtract G&A/depreciation/depletion/IDCs for taxable income, compute tax payable, add back non-cash deductions, subtract remaining capex, and discount the resulting ATCF to NPV and IRR.
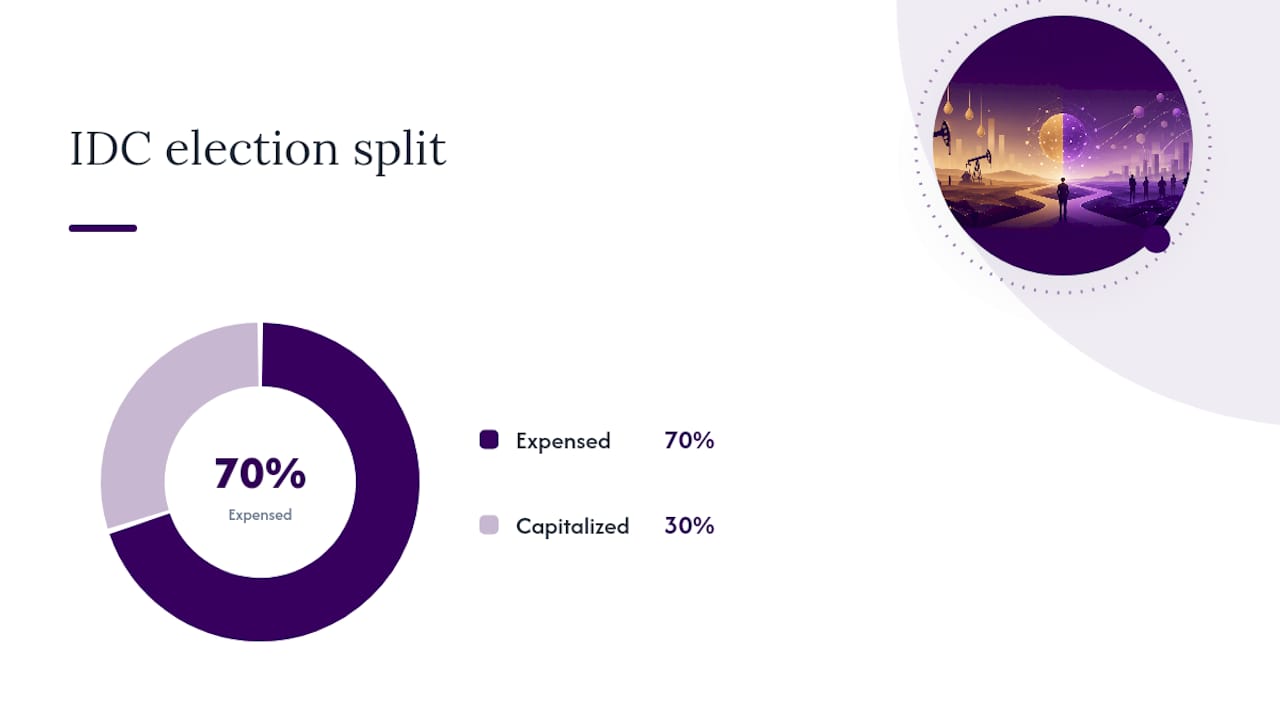
A Penn State modeling example illustrates the mechanics on a 1,000,000-barrel, five-year well with $6,000,000 in IDCs (70% expensed immediately) and $1,200,000 in mineral rights allocated to cost depletion. A simplified version looks like this:
| Year | Gross Revenue | Operating Cash Flow | IDC/Depletion Deduction | After-Tax Cash Flow |
|---|---|---|---|---|
| 0 | $0 | $0 | $6,000,000 (IDC total) | Negative (capital outlay) |
| 1 | Highest | Highest | Largest depletion year | Strong positive |
| 2 | Declining | Declining | Moderate | Positive, smaller |
| 3 | Declining further | Declining | Smaller | Positive, tapering |
| 4-5 | Tail production | Tail | Minimal | Modest, near terminal floor |
Run this same structure through Fieldvest’s tax deduction calculator with your own price deck to replicate it quickly. Then stress-test it: shift the decline rate up or down a few points, shock the price deck 20% either direction, and compare the capitalize-versus-expense IDC election. If the deal only clears your hurdle rate under the sponsor’s most optimistic case, that’s your answer.
What to Request From the Sponsor Before You Commit
Ask for the reserve report from a qualified engineer, historical production and revenue support, lease and royalty schedules, the IDC and capex breakdown, a tax allocation worksheet or purchase price allocation, operating expense history, abandonment cost estimates, and a draft Schedule K-1 or ownership carveout showing exactly what you’ll receive. Fieldvest’s reserve data interpretation guide walks through how to read the engineer’s report line by line.
Pro Tip: Insist on a reconciled tax allocation worksheet that shows precisely how the sponsor split IDC from tangible equipment. Equipment value is excluded from the depletion base, so a sloppy split can quietly shrink your deduction.
Red Flags That Should Pause a Deal
Walk away, or at least pause, if you see a missing reserve reconciliation, no IDC breakdown, production declining faster than the engineer’s stated range, undefined abandonment liability, or a price/decline tail that looks aggressive relative to the terminal floor. Three quick rules: underwrite on a conservative decline and price case, require the sponsor to show after-tax IRR under more than one tax scenario, and never accept an asset deal without a reconciled tax basis.
Why Tax-Aware Decline Modeling Changes How You Pick Deals
I’ve watched too many accredited investors underwrite oil and gas deals on pretax IRR alone, then get surprised when the depletion schedule or an aggressive decline tail changes the real return. Production viability comes first. Tax treatment amplifies a good well; it doesn’t rescue a bad one. Fieldvest’s reserve interpretation guide exists so you can check a sponsor’s numbers before you trust their model.
How Fieldvest Helps You Underwrite Faster
Fieldvest gives accredited investors something most private oil and gas sponsors won’t: a way to check their math before you wire funds, not after. Rather than taking a sponsor’s decline curve and depletion schedule on faith, you can run the same inputs, production profile, price deck, IDC split, and depletion method, through Fieldvest’s own tools and see whether the after-tax numbers hold up.

The Free Oil & Gas Tax Deduction Calculator lets you replicate the worked example above in minutes, testing your own decline assumptions and IDC elections against a sponsor’s projections. Pair that with Fieldvest’s vetted deal marketplace at Fieldvest, where every listed project comes with the documentation this article outlines, reserve reports, IDC breakdowns, and tax allocation worksheets, already organized for review. If you’re evaluating a private oil and gas deal right now, run the numbers through the calculator first and request the same document checklist from your sponsor before you commit capital.
Frequently Asked Questions
What does oil depletion actually mean for a private deal’s return? It means both the taxable income timeline and the deduction schedule shift as reserves draw down, so your after-tax cash flow rarely matches a simple pretax projection.
How does production decline affect valuation compared to reserve depletion? Production decline determines how fast volumes fall in physical terms, while depletion is the tax mechanism that lets you deduct that reserve drawdown against income. Both need separate modeling.
Is percentage depletion better than cost depletion? Neither is universally better. You use whichever produces the larger deduction each year, and percentage depletion can keep working after your cost basis is exhausted, which cost depletion cannot do.
Why shouldn’t I rely on a sponsor’s PV10 number? PV10 is a standardized SEC disclosure metric built on a fixed discount rate and historical prices. It skips tax effects and buyer-specific risk adjustments entirely, so it understates or overstates true fair market value depending on your situation.
What’s the fastest way to sanity-check a sponsor’s tax assumptions? Run their production profile and IDC split through Fieldvest’s tax deduction calculator yourself before assuming their after-tax IRR is accurate.
This article is general information, not a substitute for advice from a qualified financial advisor. Consult a qualified financial professional about your own circumstances before acting on anything here.
Sources
- Projecting oil and gas properties’ post‑acquisition cash flow | Stout
- Avoiding common pitfalls in oil and gas reserve valuations | KPMG
- A study of terminal decline rates of oil & gas wells | Payne Institute
Recommended

Get the Fieldvest Energy Brief
and AI-driven demand shifts — curated for accredited investors. Smart. Strategic. Tax-advantaged.